Posts

CPWD PAR (Plinth Area Rates) 2025 Analysis and the way to sustainability

Image
Excel has natively supported data extraction from text files and databases for over a decade. Still, the ability to directly import structured data from PDFs was a major milestone introduced in 2020 via Power Query.  Today, integrating Copilot makes this process frictionless. In a well-structured document, the AI does more than ingest raw numbers—it inherently interprets the underlying data, its broader significance, and the strategic logic behind the publication's intent. On that account, i.e., explaining the tables and how to use them for preliminary estimation, the CPWD's PAR2025 document (freely available on the   CPWD Publications | Document | Central Public Works Department, Government of India website ) passes the AI usability test. 

Domain expertise in the AI age?

Image
AI Will Not Replace Construction Professionals — It Will Empower Them While AI is transforming industries worldwide, it does not threaten the future of construction engineers and managers — it enhances it. Across the project lifecycle, AI will automate repetitive tasks, optimise scheduling, predict risks, and improve efficiency. This frees professionals to focus on what truly matters: complex problem‑solving, on‑site leadership, innovation, and the delivery of safer, more sustainable projects. Construction professionals who embrace AI as a strategic partner will be best positioned to lead this evolution. The opportunity ahead is not disruption— it is transformation. It is a chance to build better, faster, greener, and with far greater clarity than ever before.

Construction Project Management AI Use Cases

Image
Until recently, MS Excel and MS Project were the primary tools for construction managers. While these tools remain essential, the advent of AI has not only made them more accessible but also unveiled numerous innovative use cases that previous generations could only have dreamed of. This blog has historically explored potential use cases in construction projects and provided essential templates in their simplest forms, available in both MS Project and Excel formats—each ready for an AI-powered transformation. Let us start exploring possibilities.

Improving Urban Service Delivery with 3D Maps

Image
The 3D Map feature in Excel allows us to quantify parameters with context to their location. In the figure, below the feature has been used to calculate the volume of water stored in a peri-urban lake.   

PERT Simulations- How New Excel Functions Enable Transparency.

Image
We have been using complex statistical methods to answer questions like — what the probability of is completing a project in a given timeframe?   We employed the critical path method, incorporating weighted average task durations and the standard deviation of each task, utilizing the mathematical formulas presented in our Project Management course materials. The average project duration is the sum of all the average activity times along the critical path.   Knowing the average project duration and the variances of activities along the critical path allowed us to calculate the probability of completing a project using standard statistical tables.  If you are not well-versed in statistical concepts, the methods outlined in textbooks for project management may appear overly abstract and complex .  In many situations, considering the possibility of alternative critical paths becomes crucial. This can lead to additional abstractions, making it challenging to com...

A solver Solution to resolve the incomplete housing inventory

Image
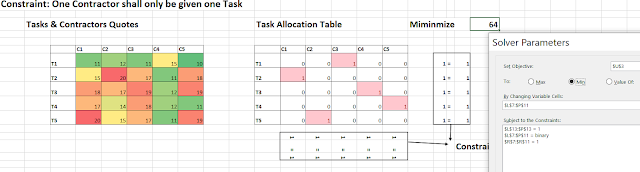
  Many solutions using the Excel solver tool as used in the field have been presented in this blog. The application ranges from structural design optimisation to revising weights to green building parameters . Solver works like magic; results are too good to be believed. Once you start using it, you understand problem formulations and asking the right questions as the only thing you ever need to know and develop. If you have never used solver, you would like to read a solver primer    first. Problem Statement Task Allocation optimisation to contractors' of specialised trade in the present scenario*. Assumption Tasks and skilled trade workforce are available in plenty. Constraints  Each contractor would take up only one or two tasks simultaneously. (They tend to grab many jobs, and all task's schedule and quality suffer as a result)  In the hypothetical problem in the sheet, " o ne Contractor 1 task, "  five tasks are allocated to five trade contr...

Life Cycle Costing Updates

Image
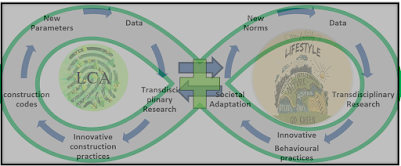
Most of India's habitat and civil infrastructure is yet to be built. The existing ones need rehabilitation and to be built better. The " LiFE mission " without enabling and integrating the construction industry is incomplete.     The model above depicts an integration of the two and is considered the first practical step towards a circular economy. Civil Infra Life Cycle need to assimilate and integrate with LiFE.  The above model for  moving towards sustainability and the Circular Economy is an extension of the earlier p roposal in the  Azadi Ka Amrit Mahotsav conference on Indigenous Engineering Solutions . Does writing integration of LCC with the LiFE mission make sense when we have not even started with Life Cycle Costing in construction practice?

No Code Development in Construction Industry, Building Research and Sustainability

Image
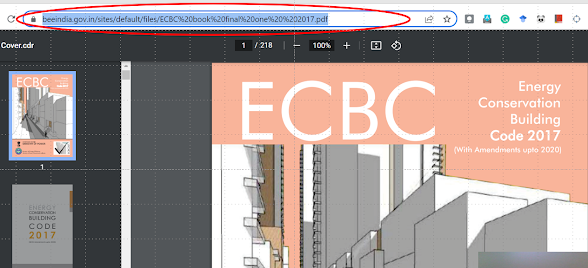
 A no-code development for Construction Billing was earlier demonstrated. The data model was restricted to the consolidation of Excel Billing files and an excel file containing theoretical consumptions of various basic inputs. The technique frees us from the tyranny of long looped Lookup formulas , the limitations of sheet rows, and how it slowed down the computer system.    However, Power Query's data extraction is not restricted to merely Excel files and folders. Here lies the opportunity to integrate the evolutionary knowledge of sustainability into construction practices and research.  In the current illustrative solution, a relevant table in the updated ECBC code, freely available on the BEE website, has been converted into a sort of App in just one sitting...and typing no code. You can download the Excel file here and the presentation showing the stepwise development of the table into a lookup-like app here . The application uses Power Query and your version ...

Indigenous Engineering Solutions in Construction, Green Buildings and Sustainability

Image
Historically, Governments have been deriving the construction Industry. In India CPWD a premier construction agency, also performs a regulatory function in setting the pace and programmes for the building industry 1 . As a part of Azadi Ka Amrit Mahotsava, a National Conference on "Indigenous Engineering Solutions in Construction of a self-Reliant India" was organised by the National CPWD Academy. Compendium of conference papers is now available on the National CPWD Academy's website.   

Why we shiver inside an old passively oriented Building?

Image
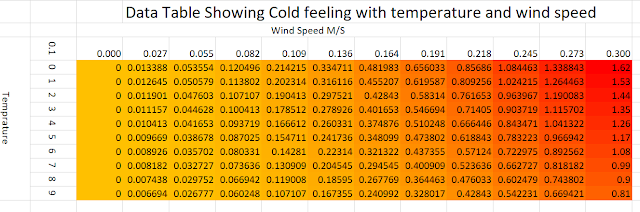
Why during winters, does it feel colder inside an old passively built habitat? And what can improve it? Yes, at present the Delhi NCR is undergoing extreme heat, the corona epidemic has forced us all to stay indoors. One is lucky to reside in a passively oriented low-rise habitat with grown-up trees. But those in high-rise apartments without passive orientation have to bear the burnt.

Sustainable Construction-Issues and Solutions

 This blog does not involve complicated simulations. Instead, it attempts to identify sustainability issues in the  Indian urban development context. All constructions are bad for the environment— considering our immense shortage we ought to build in a big way— but our building activities must show this sensitivity.

Construction Billing with Excel Update

Image
MS Excel has been used for construction billing from the very beginning of its launch. Excel 2007 with the introduction of Pivot tables made calculations like abstracts appear like magic. Other calculations like theoretical cement consumption etc. were also possible and yet total automation was not possible. Power Query and Power Pivot an addon to Excel 2010 were initially inaccessible have come of age now. The users of this blog would like to visit "Billing with MS Excel (V-1)" to see the possibilities of using pre-2013 Excel versions. The new data capabilities make Excel a gamechanger for billing and similar applications. Please look at the possibilities of this tutorial.

Using Excel Power query for Construction Billing & Data Mining

 This blog published automating construction billing during 2013. It is tried and tested and customises, nested ifs, data validation, Vlookup and workbook protection skills to meet the accounting department's requirements. Excel since then has transformed into analyzing and visualizing the big data. Construction projects have also transformed. 2013 was the time when the dashboard became fashionable, it served the purpose. Now is the time for low code, no-code development  — dashboard remains in the front but the real value and not just automating a semi-manual billing that was inherited; what present-day site monitoring and management requirements are much beyond. Construction quality and safety as demanded today can be met by freeing the site engineers from all possible non-related activities. And meeting the requirements of construction data mining. 

Excel Basics for Construction Professionals

The following blog and attachments are on an Excel Workbook that I use for my introductory classroom sessions on Excel for Construction Professionals. In a time when social distancing is prescribed, it would be better if the tool makes one learn on its own. The present one still requires a class supplementation, and I need your perspective on making it more useful.

ANGAN- Till when we would remain obsessed with refrigerants, air conditioners and high rise?

Following professional conferences, I used to write my reflections to my subject matter expert friends. This time, I felt like writing it on my blog. Climate emergency is not limited to my professional friends; it affects everyone. ANGAN (Augmenting Nature by Green Affordable New-Habitat) an International Conference organised by Bureau of Energy and giz during 9-11th September 2019 was a such an event.

Project Scenarios-What if Analysis

Image
Project conception and monitoring involve estimation risks. Estimates are uncertain. Expert judgement is used to quantify these.  However hard we plan, there would always be some random variations. Let us explore the “what if” in the forecast group at data tab.  Scenario manager here is helpful in creating various project (probable) outcomes.   This concept is best understood using an example. Click  here  to download the workbook. You need to solve it to get a grip over it. Do the followings. Use “Goal seek” to create the various break-even quantities Use “data table” to vary two variables at a time Create a “Scenario Summary” with most likely, Optimistic and Pessimistic quantities.    Run Monte Carlo simulation. These tricks allow great possibilities to a problem solver. Your comments to simplify and further explore it are welcome.

Using Excel's Forecast Sheet Feature for Construction & Life Cycle Parameters

Image
Sustainability requires that we think and act in terms of a  circular economy . ...yes massive inertia and complexity of the construction industry means that the way is very long. One step at a time would however make it happen. We can begin with the Life Cycle Costing of Buildings. This requires us to update both our knowledge base and skill sets. Many iterative cycles would be required for maturity but this should not deter us in making a small beginning. Specially when we have such intuitive features like forecasting sheet readily available in the newer version of Excel that industry uses day in and day out. Construction industry generates lots of data most of which is not used. What is usually used is for litigation and contract administration actions. Much of it is picked and chosen to make or break a case. With new data analysis features, making good use of Construction and maintenance data is easy. Appropriate databases may automatically be made to provide useful insight...

Simple Visualization of Sun,facade, Window and Shade

Image
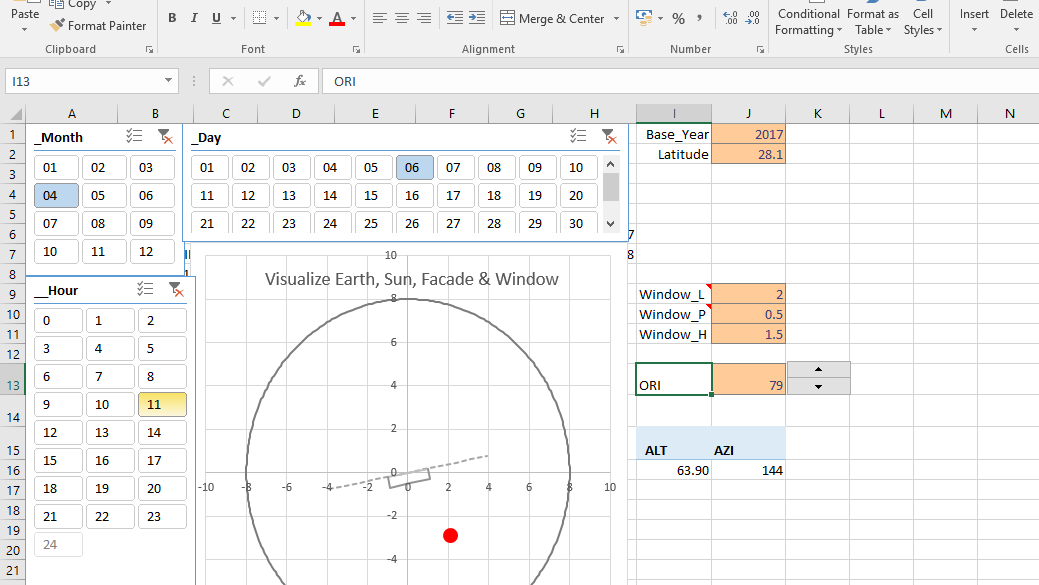
The raison d'etre of using Excel for designing/ decision making is that the solution is not a black box and professionals besides relating to basic principles can play with it through and create scenarios. Transparency of formulas and correlations when supported with basic visualizations however can authenticate decision making. Seeing is believing. Optimal solar passive design requires varying requirements.

Revising Criteria weights using Excel Solver

Image
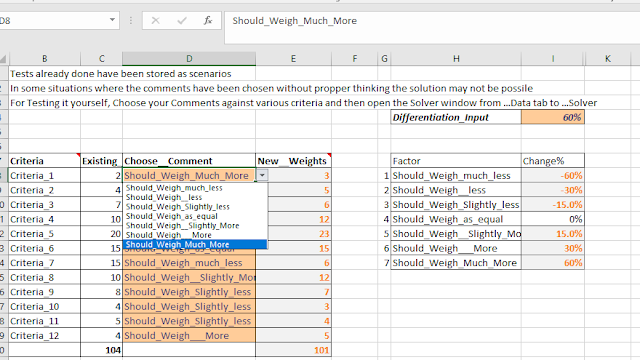
Technological and other changes are forcing organizations to quickly modify their project design requirements. For example, the successful introduction of new technologies in the construction industry would require a fundamental change in which the preliminary cost and schedule estimates are made. Changes in the weights of various inputs that go into the preliminary estimate become an immediate requirement. Design cycle improvements require training teams interactively and process inputs improvement. Project stakeholders demand improvements in the deliverables and justifications of enhancements in the first costs even if the life cycle costing of the habitat goes down. Similarly, the technique illustrated in the solution may be used in changing indicator weights as needed. (The improvements and user demand would also push the green building norms and other sustainability indicators).

Using Excel conditional formatting for comparative statements

Image
Project Control: Using Excel Conditional Formatting for guiding rate negotiations in Comparative Statement. Project control requires that the various work packages are carried out as planned. Civil construction is typically based on approved building plan and specifications. In view of progressive elaboration of project, Item rate tenders are most prevalent and provide the transparency and flexibility to both the owner and contractor. Projects are always mired with some uncertainty and items and their quantities often deviate. Various known and unknown factors affect the prices quoted by a contractor. Success of the project greatly depend on the Project’s ability to negotiate the contracts at a mutually win-win cost, performance and time frame even in the face of uncertainties. Practice of defining a Project/ work package through a Priority matrix is a handy tool for exploring on the negotiation possibilities. Time Performance ...