Posts

Showing posts from December, 2016

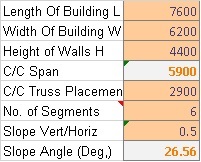
Using Excel Solver Feature to analyze and optimize the Steel Truss Design.
Image
Using Excel Solver Feature to analyze and optimize the Steel Truss Design. If you are a Structural Designer and an advanced excel user, you might have or would like to use Solver Add in in Excel to optimize various designs.This feature is a paradigm shift from one way traditional design methods. Here, you  make Excel try numerous design options/ possibilities till it meets all codal provisions for safety etc. and is also most economical. But I would like to warn the new professional that there is no substitute to getting deep into the design process and asking right questions from the professional peers and industry stakeholders. For why you should design with excel please refer to my previous blog at   http://www.ashutoshp.in/2014/01/why-design-using-excel.html

Useful Chart for a Construction Manager

Image
Charting in excel is mostly intuitive and easy. However sometimes it can be tricky. One such situation is when it is pertinent to show two supporting parameters which are quantitatively on different scales. Here you want to boast your team’s efficiency who have  increased their turnover (Value Created)  while cutting down their establishment costs.

Excel Solver Primer for Construction Stakeholders

Image
Solver in Excel does what its name is. Like any other excel tool it is best learnt through an example. Let us look at stakeholder’s motives.  Builder’s motives are plain and simple profit maximization. Professional motives are a bit complex and difficult to formulate.  The Architect want space planning to meet his design vision. The Green Building Professional wants external façade to optimize daylight as well as thermal insulation. The structural and project Engineers want  the structure and construction process to be safe. The Project Management team is required to satisfy the needs of all the stakeholders.